

AutismKB 2.0
- Data Collection

- We conducted a systemic review of the ASD literature by using the query term 'autis*[Title/Abstract]' to search the PubMed database.
- Collecting of meta-data
- Information about key clinical and demographic characteristics of each study was collected.
- Genome-Wide Association Studies(GWAS)
- CNV/SV Studies
- Linkage Analyses
- Low-Scale Genetic Association Studies
- Expression Profilings
- NGS de novo Mutation Studies
- NGS Mosaic Mutation Studies
- NGS Other Studies
- Low-Scale Gene Studies
Categories Related Features Publication First author Year of publication PubMed ID date of the inclusion Population Ancestral background, Country of origin Sample and control inclusion and exclusion criteria Number of cases and controls with gender ratio Age at examination Diagnosis Criteria Type "GWAS" (genome-wide association study);
"Chromosome #" (chromosome-wide association study);
"cSNP" (coding-region SNP);
"pooled" (large-scale association study based on pooled genotyping);
"Other" (other large-scale association study);Stage Discovery/Replication Study Design Family-based or case-control Methods/Platform Results Number of polymorphisms Related Genes P value and combined P value Genotype & allele distribution Polymorphism (dbSNP ID or most commonly used name) Genotype distribution (allele frequency and genotype frequency) Other autism related features IQ autism-specific endophenotype Table 1: Collected features of GWAS studies
Categories Related Features Publication First author Year of publication PubMed ID date of the inclusion Population Ancestral background, Country of origin Sample and control inclusion and exclusion criteria Number of cases and controls with gender ratio Age at examination Diagnosis Criteria Study Design Family-based or case-control Methods/Platform Results CNV regions (chromosome, start and end) Band Gain/Loss Evidence Type CNVs Only Present In Patients;
De novo CNVs;
Overlapping/Recurrent CNVs;
CNVs Overlapping With ACRD;
CNVs Not Present In Control;
Significant Enriched CNVs;
OthersTable 2: Collected features of CNV studies
Categories Related Features Publication First author Year of publication PubMed ID date of the inclusion Population Ancestral background, Country of origin Sample and control inclusion and exclusion criteria Number of cases and controls with gender ratio Age at examination Diagnosis Criteria Study Design Family-based or case-control Methods/Platform Results Linkage regions (chromosome, start and end) Band Marker LOD, NPL or P value Table 3: Collected features of Linkage Analyses
Categories Related Features Publication First author Year of publication PubMed ID date of the inclusion Population Ancestral background, Country of origin Sample and control inclusion and exclusion criteria Number of cases and controls with gender ratio Age at examination Diagnosis Criteria Study Design Family-based or case-control Methods/Platform Results Reported gene name Reported study results (positive or negative) P value Genotype & allele distribution Polymorphism (dbSNP ID or most commonly used name) Genotype distribution (allele frequency and genotype frequency) Other autism related features IQ autism-specific endophenotype Table 4: Collected features of Low-Scale Genetic Association Studies
Categories Related Features Publication First author Year of publication PubMed ID date of the inclusion Population Ancestral background, Country of origin Sample and control inclusion and exclusion criteria Number of cases and controls with gender ratio Age at examination Diagnosis Criteria Tissue Used Study Design Methods/Platform Statistic Methods Geo ID Results Reported gene name Reported probes/ESTs/RefSeq_ID Fold Change; Up or Down regulated; P value Other autism related features IQ autism-specific endophenotype Table 5: Collected features of Microarray studies
Categories Related Features Publication First author Year of publication PubMed ID date of the inclusion Population Ancestral background, Country of origin Sample and control inclusion and exclusion criteria Number of cases and controls with gender ratio Age at examination Diagnosis Criteria Tissue Used Study Design Methods/Platform Results Reported gene name Table 6: Collected features of protemics studies
Categories Related Features Publication First author Year of publication PubMed ID date of the inclusion Population Ancestral background, Country of origin Number of cases and controls with gender ratio Diagnosis Criteria Study Design Methods/Platform Mutation Information Location information on the chromosome amino acid mutation information Validated Method Table 7: Collected features of NGS de novo Mutation Studies
Categories Related Features Publication First author Year of publication PubMed ID date of the inclusion Population Ancestral background, Country of origin Number of cases and controls with gender ratio Diagnosis Criteria Study Design Methods/Platform Mutation Information Location information on the chromosome amino acid mutation information Validated Method Table 8: Collected features of NGS Mosaic Mutation Studies
Categories Related Features Publication First author Year of publication PubMed ID date of the inclusion Population Ancestral background, Country of origin Number of cases and controls with gender ratio Diagnosis Criteria Study Design Methods/Platform Mutation Information Location information on the chromosome amino acid mutation information Validated Method Categories Related Features Publication First author Year of publication PubMed ID date of the inclusion Population Ancestral background, Country of origin Number of cases and controls with gender ratio Diagnosis Criteria Tissue Used autism-specific endophenotype Study Design Methods/Platform Results Reported gene name Description of the gene with autism Reported study results (positive or negative) Evidence Type Genetics; RNA level function; protein level function Table 10: Collected features of Low-Scale Gene Studies
- Quality Score
- We made a scoring system to score different datasets. All the genes in the CNVs or Linkage Regions were retrieved from UCSC. Table 11 shows the function of our score system.
- Function of Quality Score for different categories
Experimental Methods Quality Score of the genes Genome-Wide Association Studies (GWAS) Score 1: one positive study (P<=1e-5);
Score 2: two positive studies and P>1e-7;
Score 3: two positive studies and P<=1e-7Genome-Wide Copy Number Variation/Structure Variation (CNV/SV) Studies Score 1: 1-3 positive studies;
Score 2: 4-8 positive studies;
Score 3: >=9 positive studiesLinkage Studies Score 1: 1-3 positive studies;
Score 2: 4-8 positive studies;
Score 3: >=9 positive studiesLow-Scale Genetic Association Studies Score 1: one positive study (P<=0.05);
Score 2: two or more positive studies and P>0.001;
Score 3: two or more positive studies and P<=0.001Expression Profilings Score 1: one positive study;
Score 2: two positive studies
Score 3: three or more positive studiesNGS de novo Mutation Studies Score 1: one positive study;
Score 2: two positive studies
Score 3: three or more positive studiesNGS Mosaic Mutation Studies Score 1: one positive study;
Score 2: two positive studies
Score 3: three or more positive studiesNGS Other Studies Score 1: one positive study;
Score 2: two positive studies
Score 3: three or more positive studiesLow-Scale Gene Studies Score 1: one positive study;
Score 2: two positive studies
Score 3: three or more positive studiesTable 11: Function of the score system
- Ranking System
- Ranking Algorithm
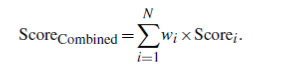
- The scores from each experimental type are weighted specifically and then to be a combined score calculated by the following function:
- Scorei=0 if no positive evidence.
- For N datasets, there are possible K (e.g. N+1) different weights, thus, it forms a KN weight matrix pool.
- Benchmark Dataset
- In the new version, the benchmark data set was made of 46 non-syndromic autism-related genes were from the SPARK (Simons Foundation Powering Autism Research for Knowledge) gene list. SPARK Source
- Weight Matrix
- (1) For each weight matrix in the matrix pool, a combined score is calculated for each gene by function 1.
- (2) All genes collected from all sources and the core genes are sorted by their combined scores, respectively.
- (3) In these two sorting lists, a vector is generated to record the ranking positions of core genes in the ranked candidate gene list.
- (4) Select the matrix if m of the core genes is ranked in the top n of the candidate genes. The position ( j) where the m-th gene locates in the candidate gene list is recorded for the evaluation in step two.
- (5) Repeat the above steps until all weight matrices are analyzed.
- The cutoff score is based on top 80% benchmark genes.
- The matrix with the best gene rank was chosen:
Categories GWAS CNV Linkage Low-Scale Association Expression NGS De Novo NGS Mosaic NGS Other Low-Scale Gene Studies Weight 4 2 2 2 1 10 1 8 10 Table 12: Final Weight Matrix
- Ranking Algorithm