
Gene Annotation Documents
- Introduction
- Version of each source database
- Gene basic information
- General annotaion
- Gene Ontology
- Protein-protein interation
- Genomic variants
- Homologues in model organisms
- Links to other Psychiatric Disease Gene Databases
- Gene expression
- Gene regulation
- Post Translational Modification
- Validated transcription factor binding site
- Validated miRNA targets
- Cis-antisense regulation
- Related Pathways and Diseases
- Introduction

- Gene annotation was divided to four sections. The General Annotation section, describes the gene from many databases, includes information about Gene Ontology, the protein-protein interaction about this gene, genomic variants, animal model and other psychiatric disease gene databases. The Gene Expression details, showed the expression level of this gene in different cell lines and tissues which was measured by EST, RNA seq, Microarray and ISH. It also provides the peptide evidence. Moreover, we provide the annotation of gene regulation. We provide the information of PTM, validated TF binding site, validated mRNA targets and Cis-antisense. Our database also provides detailed pathway annotaion and the related diseases of this gene. The related drugs information is also avaliable in our database. We hope these will help you understand more about this gene and autism. You can click on the button to switch among the four parts.
- In each page, we also provide the guider bar on the top of the page. If you get lost in the page, you can click the up-arrow to the top and click on the guider bar to a new section that you want.
- Version of each source database
- Gene basic information
- Basic information about a gene includes gene symbol, full names and direct links to a few other useful databases.
- General annotaion
- Gene Ontology
- Gene ontology was parsed from NCBI gene2go.gzwhich reports the GO terms associated with genes in Entrez Gene. Here we separate the GO items based on its categories to three parts, Cellular Component, Molecular Function and Biological Process. If you want to see the detailed items, please click on the tag. Each term contains the GO ID, Evidence, Qualifier, GO items and associated publication.
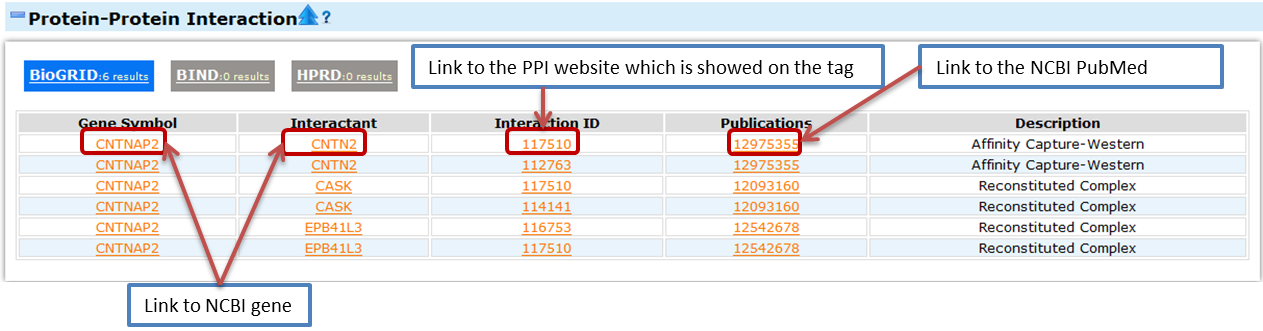
- Protein-protein interation
- The data was parsed from NCBI ftp interactions.gz which offers information about protein-protein interaction. This file is the description of two interactants and resulting complex. If both the two interactants are gene product and associated with Gene IDs, the pair of interacting only appeared once and the interactants with the smaller Gene ID appeared in the first column as Gene Symbol and the larger one appeared as the Interactant in the second column. The data was collected from three databases, BioGRID, BIND and HPRD. You can click on the Interaction ID to see the detailed protein-protein interaction on the website of BioGIRD, BIND or HPRD. You can click on these tags to switch among the three databases.
- Genomic variants
- The data is about the genomic variants in the gene. The data was parsed from DGV (Database of Genomic Variants). It contains four kinds of genomic variants, CNV, indel, inversion and inversion breakpoint. You can click on these tags to switch among them.
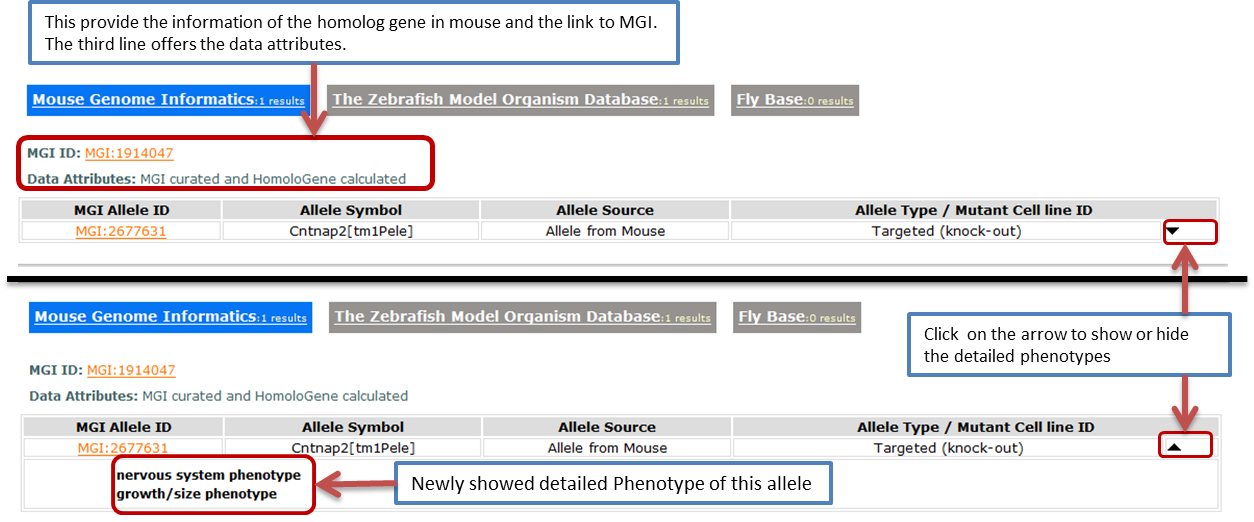
- Homologues in model organisms
- This part provides information about the orthologs in other animals and its allele. It also provide the information of the genotype and phenotype of the alleles. If you want to choose one animal model, this part will help you. It contains three animal, mouse, zebrafish and fruit fly. You can switch among these by clicking the tag.
- Mouse
- The first tab links to the homolog gene in mouse. In this tab, we collected information from MGI
- We get these files from the ftp of MGOur information is from HMD_Human5.rpt, MPheno_OBO.ontology, VOC_MammalianPhenotype.rpt, MGI_PhenotypicAllele.rpt, MGI_QTLAllele.rpt, KOMP_Allele.rpt, EUCOMM_Allele.rpt.
- Zebrafish
- The second tab links to homolog genes in zebrafish.
We get this information from ZFIN. The download website for ZFIN is http://zfin.org/zf_info/downloads.html. - Fruit Fly
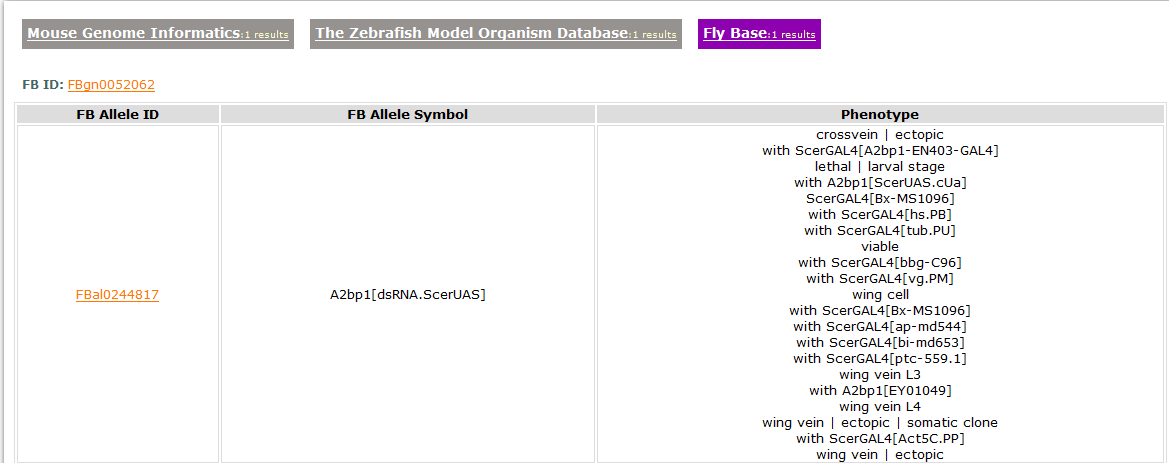
- The third tab links to homolog genes in fruit fly.
We download data of homologene from Inparanoid and the detailed annotation data for the homolog gene in fruit fly from the FlyBase. It offers the gene link and allele link to the FlyBase. - Links to other Psychiatric Disease Gene Databases
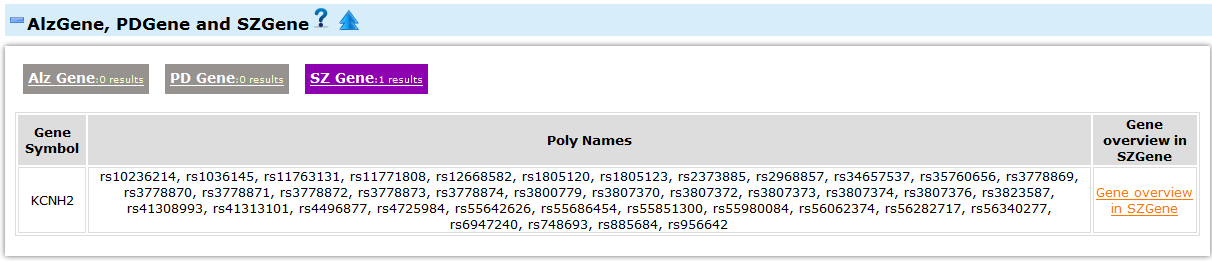
- This part includes three psychiatric disease gene databases, Alzgene, PDgene and SZgene. The Alzgene provides a comprehensive and regularly updated synopsis of genetic association studies of in Alzheimer's disease. PDgene is a database for Parkinson's disease genetic association studies. And SZgene is a database of genetic association studies of schizophrenia.
- Gene expression
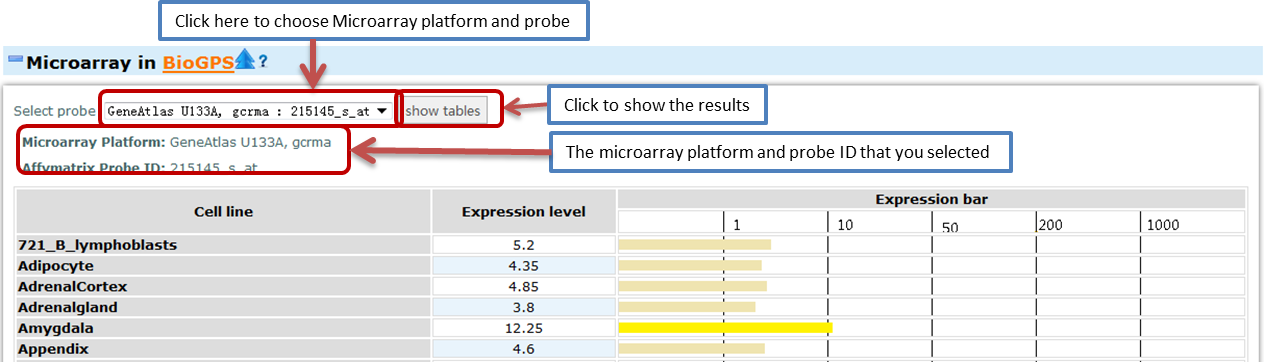
- Here we use the length of bar to show the detailed expression level of each gene.
- Data were shown as following methods:
- When the express level is under than 1, the color is green.

- When the express level is between 1 and 10, the color is light yellow.

- When the express level is between 10 and 50, the color is yellow.

- When the express level is between 50 and 200, the color is golden.

- When the express level is between 200 and 1000, the color is orange.

- When the express level is bigger than 1000, the color is light red.

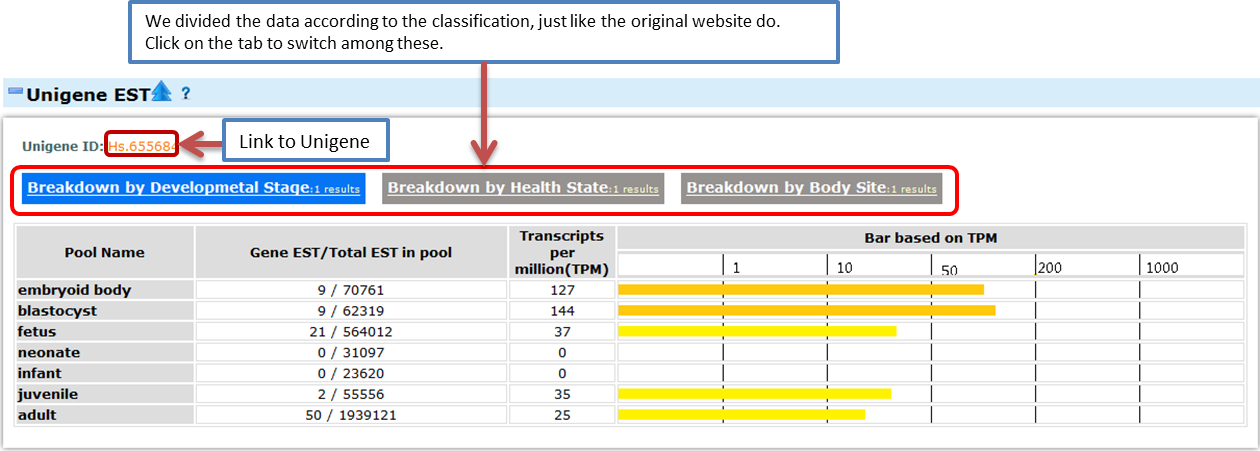
- Unigene EST
- We collected the EST profiles data from NCBI Unigene. EST profiles show approximate gene expression patterns as inferred from EST counts and the cDNA library sources (as reported by sequence submitters). Libraries known to be normalized, subtracted, or otherwise biased have been removed. For a variety of reasons, EST counts are only a rough indication of gene expression level.
- RNA seq
- In this part, we measure the expression level of the genes by RPKM. The RPKM is computed in number of reads per kilobase of exon or intron or intergenic regions model per million mapped reads. It can show the mean read density values for different part of the genome, the exons, introns, and intergenic regions.
- We download the RNA seq data from UCSC. Here we collected three RNA seq data. The three data is showed as follows. The description was cited from the UCSC schema description.
- Microarray
- This part of information was from the BioGPS. In this part, you can choose different Microarray types and different probes to view the expression level of this gene. GC-RMA is used to normalize and summarize the microarray data. The expression bar was made based on the download data. So it may be not the same as the map in the BioGPS website for we did not have the original data. In some tables, the downloaded data have duplicated columns. In that case, we provide the mean and range of the data in our tables.
Microarrays are useful for comparing single probe sets across multiple samples to compare the expression values. - Allen Brain Atlas
- In this part we download data from the website of Allen Brain Atlas. This website provides inoformation on gene expression in human and mouse brain, including microarray data and ISH images.
- Human Whole Brain Microarray
- The downloaded data of human microarray data was from two donors, Donor H0351.2001 and Donor H0351.2002. The description of the donor was listed under the tab.
- Here is some explanation of the items in the description.
- The expression level was in a small range, 0 to 19. So here we use a simple color and the length of the bar to show the expression level of the gene. The human Whole Brain Microarray covers more than eight hundreds part of the brain, so it is hard to show the detailed expression in such a small table. So we group the slabs to 22 brain regions by the brain ontology which was provided by the origin website. We also show the mean and standard errors of each brain region part.
- Mouse ISH
- Mouse in situ hybridization (ISH) detects specific RNA sequences within a section of tissue. Here the Allen Brain Atlas project label the cells which expressed a particular transcripts using a non-radioactive, digoxigenin (DIG) based technique. The data includes expression level and expression density.
- Peptide
- This part of data is from Peptide Atlas and PRIDE detecting by mass spectrum experiment.
- Gene regulation
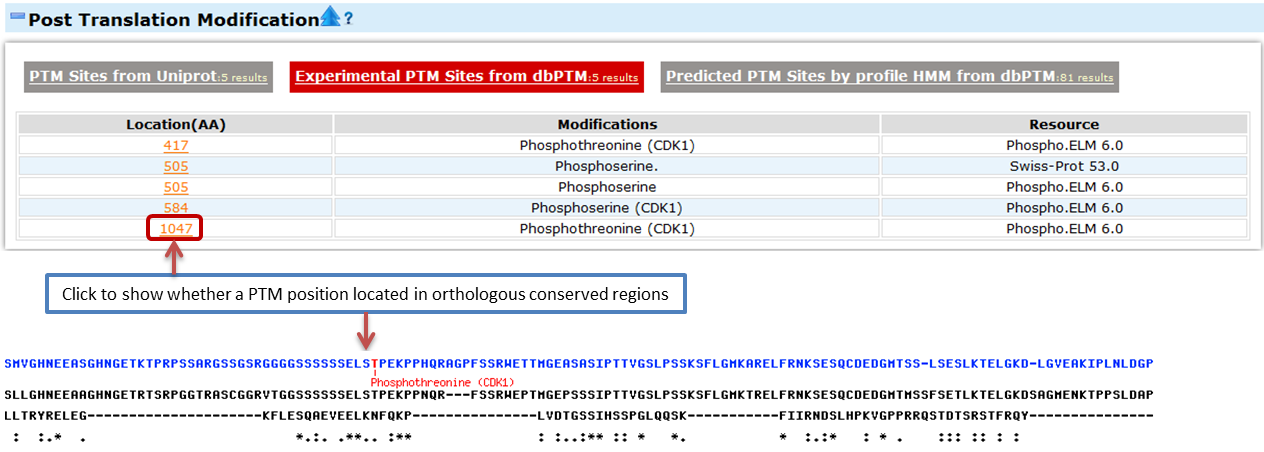
- Post Translational Modification
- This part provides the user data of the related regulation factors of this gene. We collected the information from the public databases.
- Post Translation Modification (PTM) is the chemical modification on an amino acid on the protein or peptide after its translation. Here we collected the PTM information from Uniprot and dbPTM.
- PTM sites from Uniprot
- We use the PTM data from Uniprot.
- Experimental PTM Sites from dbPTM
- dbPTM collects data from Swiss Prot, Phospho ELM and OGlycBase.
- Predicted PTM sites by HMM from dbPTM
- This part is the prediction of PTM sites by Hidden Markov Model from dbPTM.
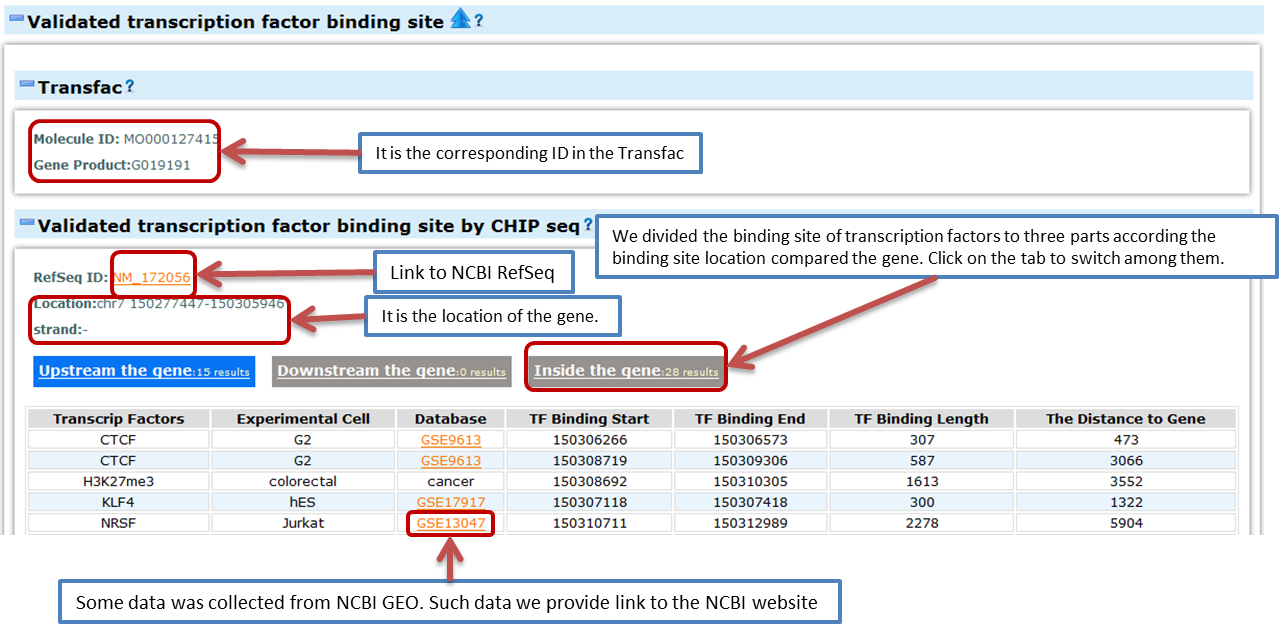
- Transcription factor binding sites
- ChIP-Chip and ChIP-Seq
- ChIP-Seq combines the Chromatin immunoprecipitation (ChIP) with next generation sequencing to detect the interaction of protein and DNA. Here we provide information about the proteins that bind near the gene (2kb upstream and downstream) based on CHIP-Seq experiment results. These proteins may be the possible transcription factors that regulate the expression of this gene. The data source (GEO ID) is also provided. Here we use hg18 to describe the chromosome coordinates of the gene and binding sites.
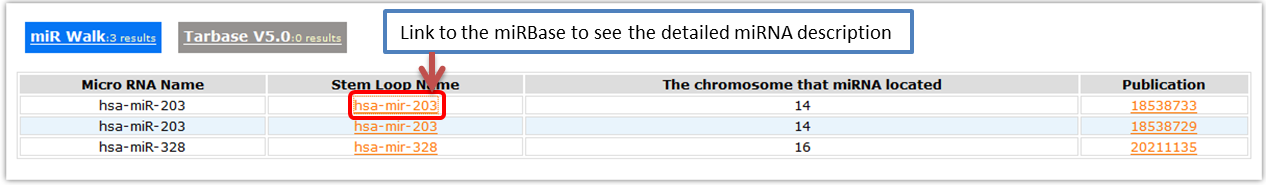
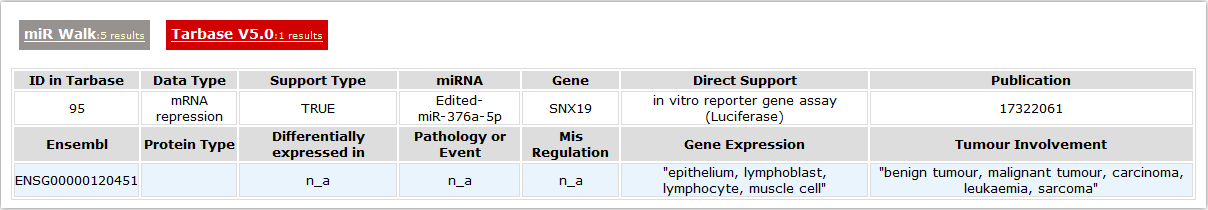
- Validated miRNA targets
- MicroRNAs are important regulators of genes in multiple bioprocesses. Different sets of expressed miRNAs are found in different cell types and tissues. Here we collected the miRNA targets from miR Walk and Tarbase.
- miR Walk
- Here we provide the validated miRNA that involved in this gene.
- Tarbase
- Tarbase is a database which houses a manually curated collection of experimentally supported microRNA targets in several animal species of central scientific interest, plants and viruses.
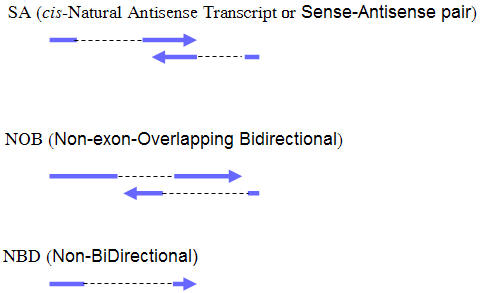
- Cis-antisense regulation
- This part of information is from NATsDB. Natural Antisense Transcripts (NATs) are RNAs that are at least partially complementary to other endogenous RNAs. Changes in antisense transcription have been implicated in pathogenesis such as cancer and neurological disease. SA (Sense/Antisense) pairs and NOB (Non-exonic Bidirectional) pairs are included.
- Here we provide the chromosome location of the gene and its NATs pairs.
- Related pathways, diseases and drugs
- We colected this part of information from KOBAS 2.0, CTD, PharmGKB and Drugbank. This part provied detaied information about any related pathways, diseases and drugs.
- Related pathway information
- We get this part of information from KOBAS 2.0.
KOBAS 2.0 maps a gene to KEGG PATHWAY, PID Curated, PID BioCarta, PID Reactome, BioCyc, Reactome and Panther pathway databases.
- Related disease/Disorders information from KOBAS
- KOBAS 2.0 also maps a gene to KEGG DISEASE, GAD, FunDO, OMIM and NHGRI human disease databases.
- Chemical, desease and pathway information from CTD
- This part of information is downloaded from CTD, the Comparative Toxicogenomics Database. It lists the chemicals that may affect the gene. We provide links to the original website.
- Pharmacogenomics Knowledge Base
- This part of information is collected from PharmGKB. It provides information about the gene-disease-drug relationship and impact of human genetic variations on drug response.
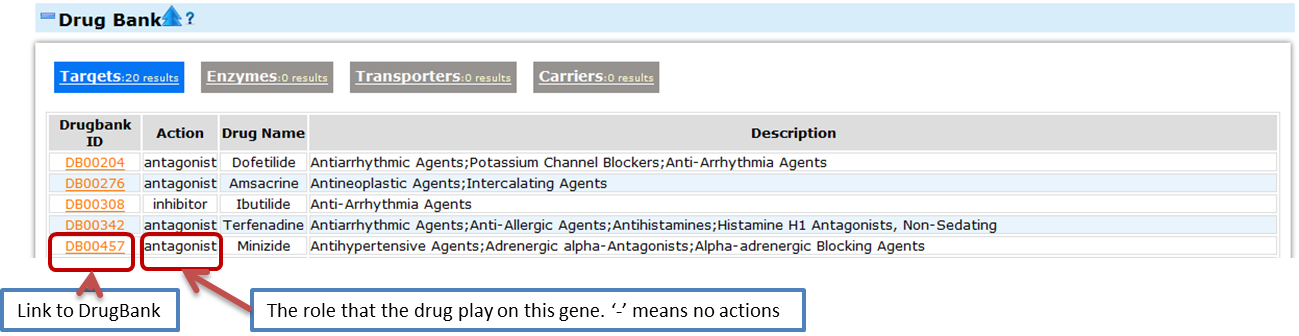
- Drugbank
- DrugBank is a database that combined the detailed drug data with the drug targets information. Here we provide information about the related drugs. The whole information is devided to four parts accoding to the relationship beteen the drug and the gene product. For the same drugs may play different role on differenct gene product, we also provide the drug action in each item.

| Source Databases | Version | Source |
|---|---|---|
| Gene ontology | May 30, 2011 | gene2go.gz |
| Protein-protein interaction (HPRD, BIND, BioGRID) | May 25, 2011 | interactions.gz |
| DGV (Database of Genomic Variants) | Mar 2010, Build 36, hg18 | variation.hg18.v9.txt |
| MGI | Feb 20, 2011 | ftp |
| ZFIN | Feb 18, 2011 | Download page |
| FlyBase | FB 2011_02 | Download page |
| Alzgene | Dec 23, 2010 | Alzgene |
| PDgene | Dec 22, 2010 | PDgene |
| SZgene | Jan 19, 2011 | SZgene |
| Unigene profile | Feb 23, 2011 | ftp |
| Burge RNA seq | Nov 27, 2008 | paper |
| Caltech RNA seq | Oct 4, 2010 | UCSC ftp |
| Yale RNA seq | Dec 8, 2009 | paper |
| BioGPS | Jun 1, 2011 | Download page |
| Allen Brain Atlas | May 31, 2011 | Human Mouse |
| PRIDE | Apr 22, 2011 | Biomart |
| Peptide Atlas | May 30, 2010 | Download page |
| Uniprot PTM | Uniprot release 2011_08 | Download page |
| dbPTM | Nov 3, 2008 | Download page |
| miRWalk | May 25, 2011 | Submit gene list and get table |
| Tarbase | Tarbase v5.0 | Download page |
| Cis-Nats | Apr 10, 2010 | ftp |
| Pathway & disease from KOBAS 2.0 | Aug 9, 2011 | kobas2.0-data-20110809.tar.gz |
| CTD | Jun 10, 2011 | Download page |
| Pharm GKB | Jun 20, 2011 | Download page |
| Drug Bank | Jun 23, 2011 | Download page |


| Name | Resouse | Description |
|---|---|---|
| Burge RNA-seq | Burge lab RNA-seq algned by GEM Mapper | Sequenced by Illumina Mapped reads by CRG using default parameters and allowing up to two mismatches Data from tissues and cell lines Reads length: 32bp |
| Caltech RNA-seq | ENCODE Caltech RNA-seq | Sequence by Illumina Mapped with Bowtie. Bowtie-unmapped reads were mapped using BLAT to find novel splicing Analyzed by ERANGE 3.0 package Data from 7 cell lines, polyA selected from total cellular RNA Reads: 1x32 nt 2x 75 nt 1x75 nt |
| Yale RNA-seq | ENCODE RNA-seq from Yale/UC-Davis/Havard | Short Illumina single and paired-end reads and longer Roche 454 FLX and Titanium sequencing reads Sequence reads of 27-33 nt long and with 0-2 mismatches |